
What does PET actually measure?
X-rays and computed tomography (CT) show how different tissues attenuate X-rays. Magnetic resonance imaging (MRI) uses the behaviour of atomic nuclei in a magnetic field and can reveal exceptional detail in soft tissue. emission tomography (PET) asks a different question: where did the go, and how much accumulated in each part of the body? This is why PET is called functional or molecular imaging.
A PET image does not resolve individual cells, and the camera does not directly look inside them. It depicts the spatial distribution of signals from many molecules tagged with radioactive atoms. Depending on the chosen tracer, the distribution may inform us about glucose use, blood flow or the presence of a particular protein. Clinical PET resolution is measured in millimetres; very small changes can be missed, especially beside organs that naturally take up a lot of tracer.
It would be wrong to claim PET always detects disease before CT. Sometimes molecular change is visible before a clear change in tissue shape, but this depends on the disease, tracer, lesion size and scan quality. CT and MRI can also provide functional information with specialised protocols. Clinicians select the method for the specific question at hand.
From cyclotron to cell: why is FDG so important?
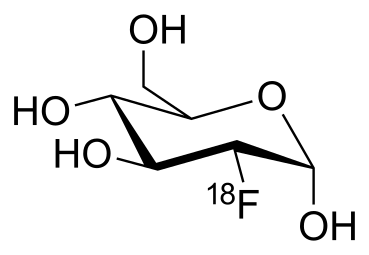
Many radiopharmaceuticals combine a molecule involved in a biological process, or one that binds to a tissue target, with a -emitting radionuclide. Many PET radionuclides are produced in a , which accelerates charged particles. In the commonly used tracer , fluorine-18 is part of a glucose-like molecule. Fluorine-18 has a physical half-life of about 110 minutes: after that time, a sample’s radioactivity has halved, regardless of how the body excretes the tracer.
enters many cells through glucose transporters. Hexokinase then adds a phosphate group to it. The resulting -6-phosphate has difficulty leaving the cell and usually does not continue through the next normal step of glycolysis. This metabolic trapping makes tissues that take up more produce a stronger PET signal. It is a useful approximation of glucose use, but the signal is not simply a count of living or malignant cells: blood supply, transporter activity and scan timing also matter.
Many tumours take up more glucose and favour glycolysis even when oxygen is available. This is associated with the , but there is no universal rule that every tumour consumes a fixed multiple of normal glucose use. Slow-growing tumours may have a weak signal, while active immune cells in infection or inflammation can light up strongly. traces particular biological processes; it does not recognise cancer alone.
Anypodetos · Sources ↗
How does a positron become a point on an image?
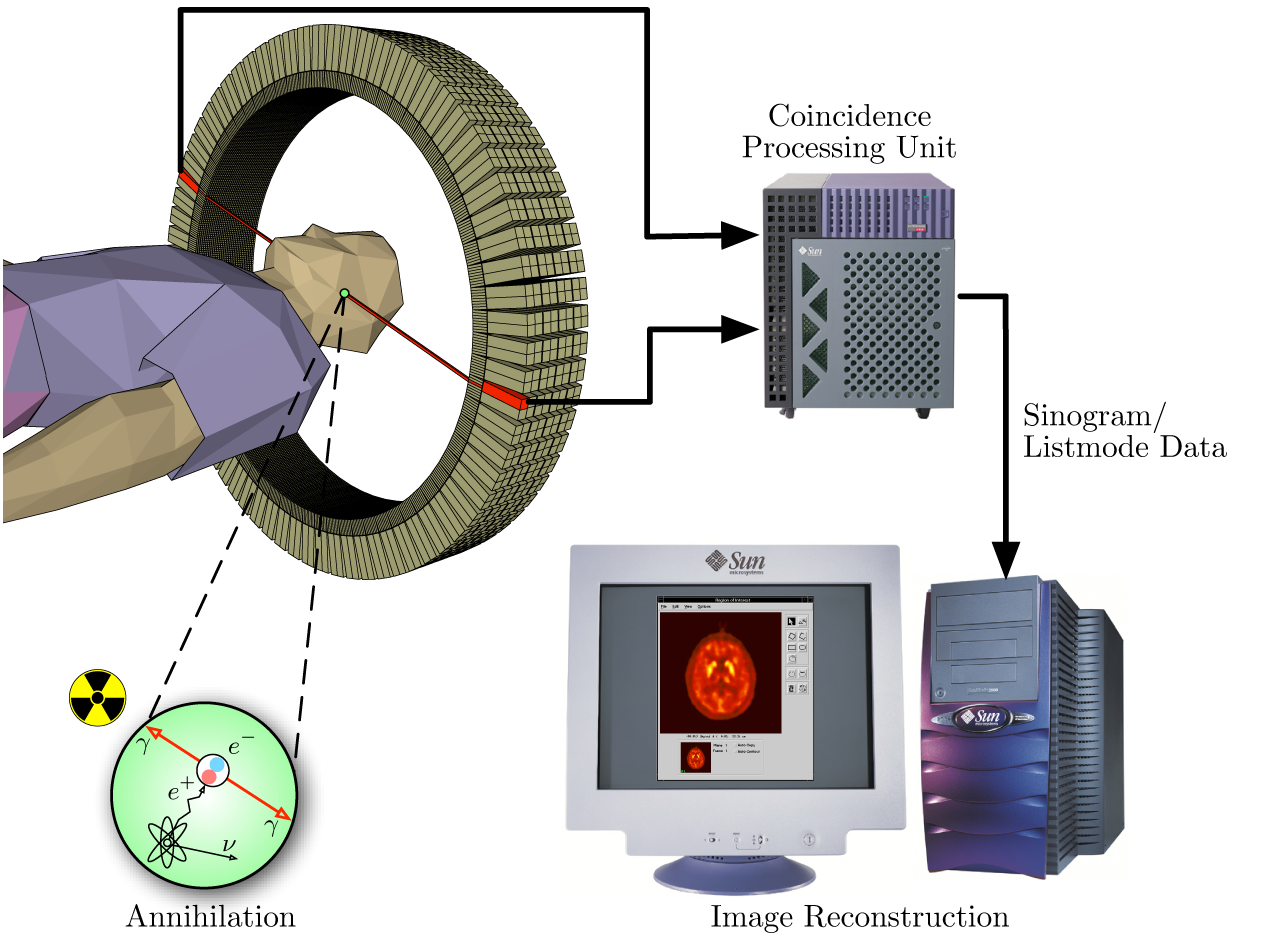
A fluorine-18 nucleus undergoes beta-plus decay: a proton changes into a neutron, emitting a and a neutrino. The has the electron’s mass but the opposite electric charge. It travels a short distance in tissue before stopping; that distance depends on the radionuclide’s energy and limits PET image sharpness.
When the slowed meets an electron, they annihilate. Their mass energy largely appears as two gamma photons, each with an energy of 511 kiloelectronvolts. They travel in almost, though not mathematically exact, opposite directions. That small deviation, together with the ’s travel before , prevents infinitely precise localisation.
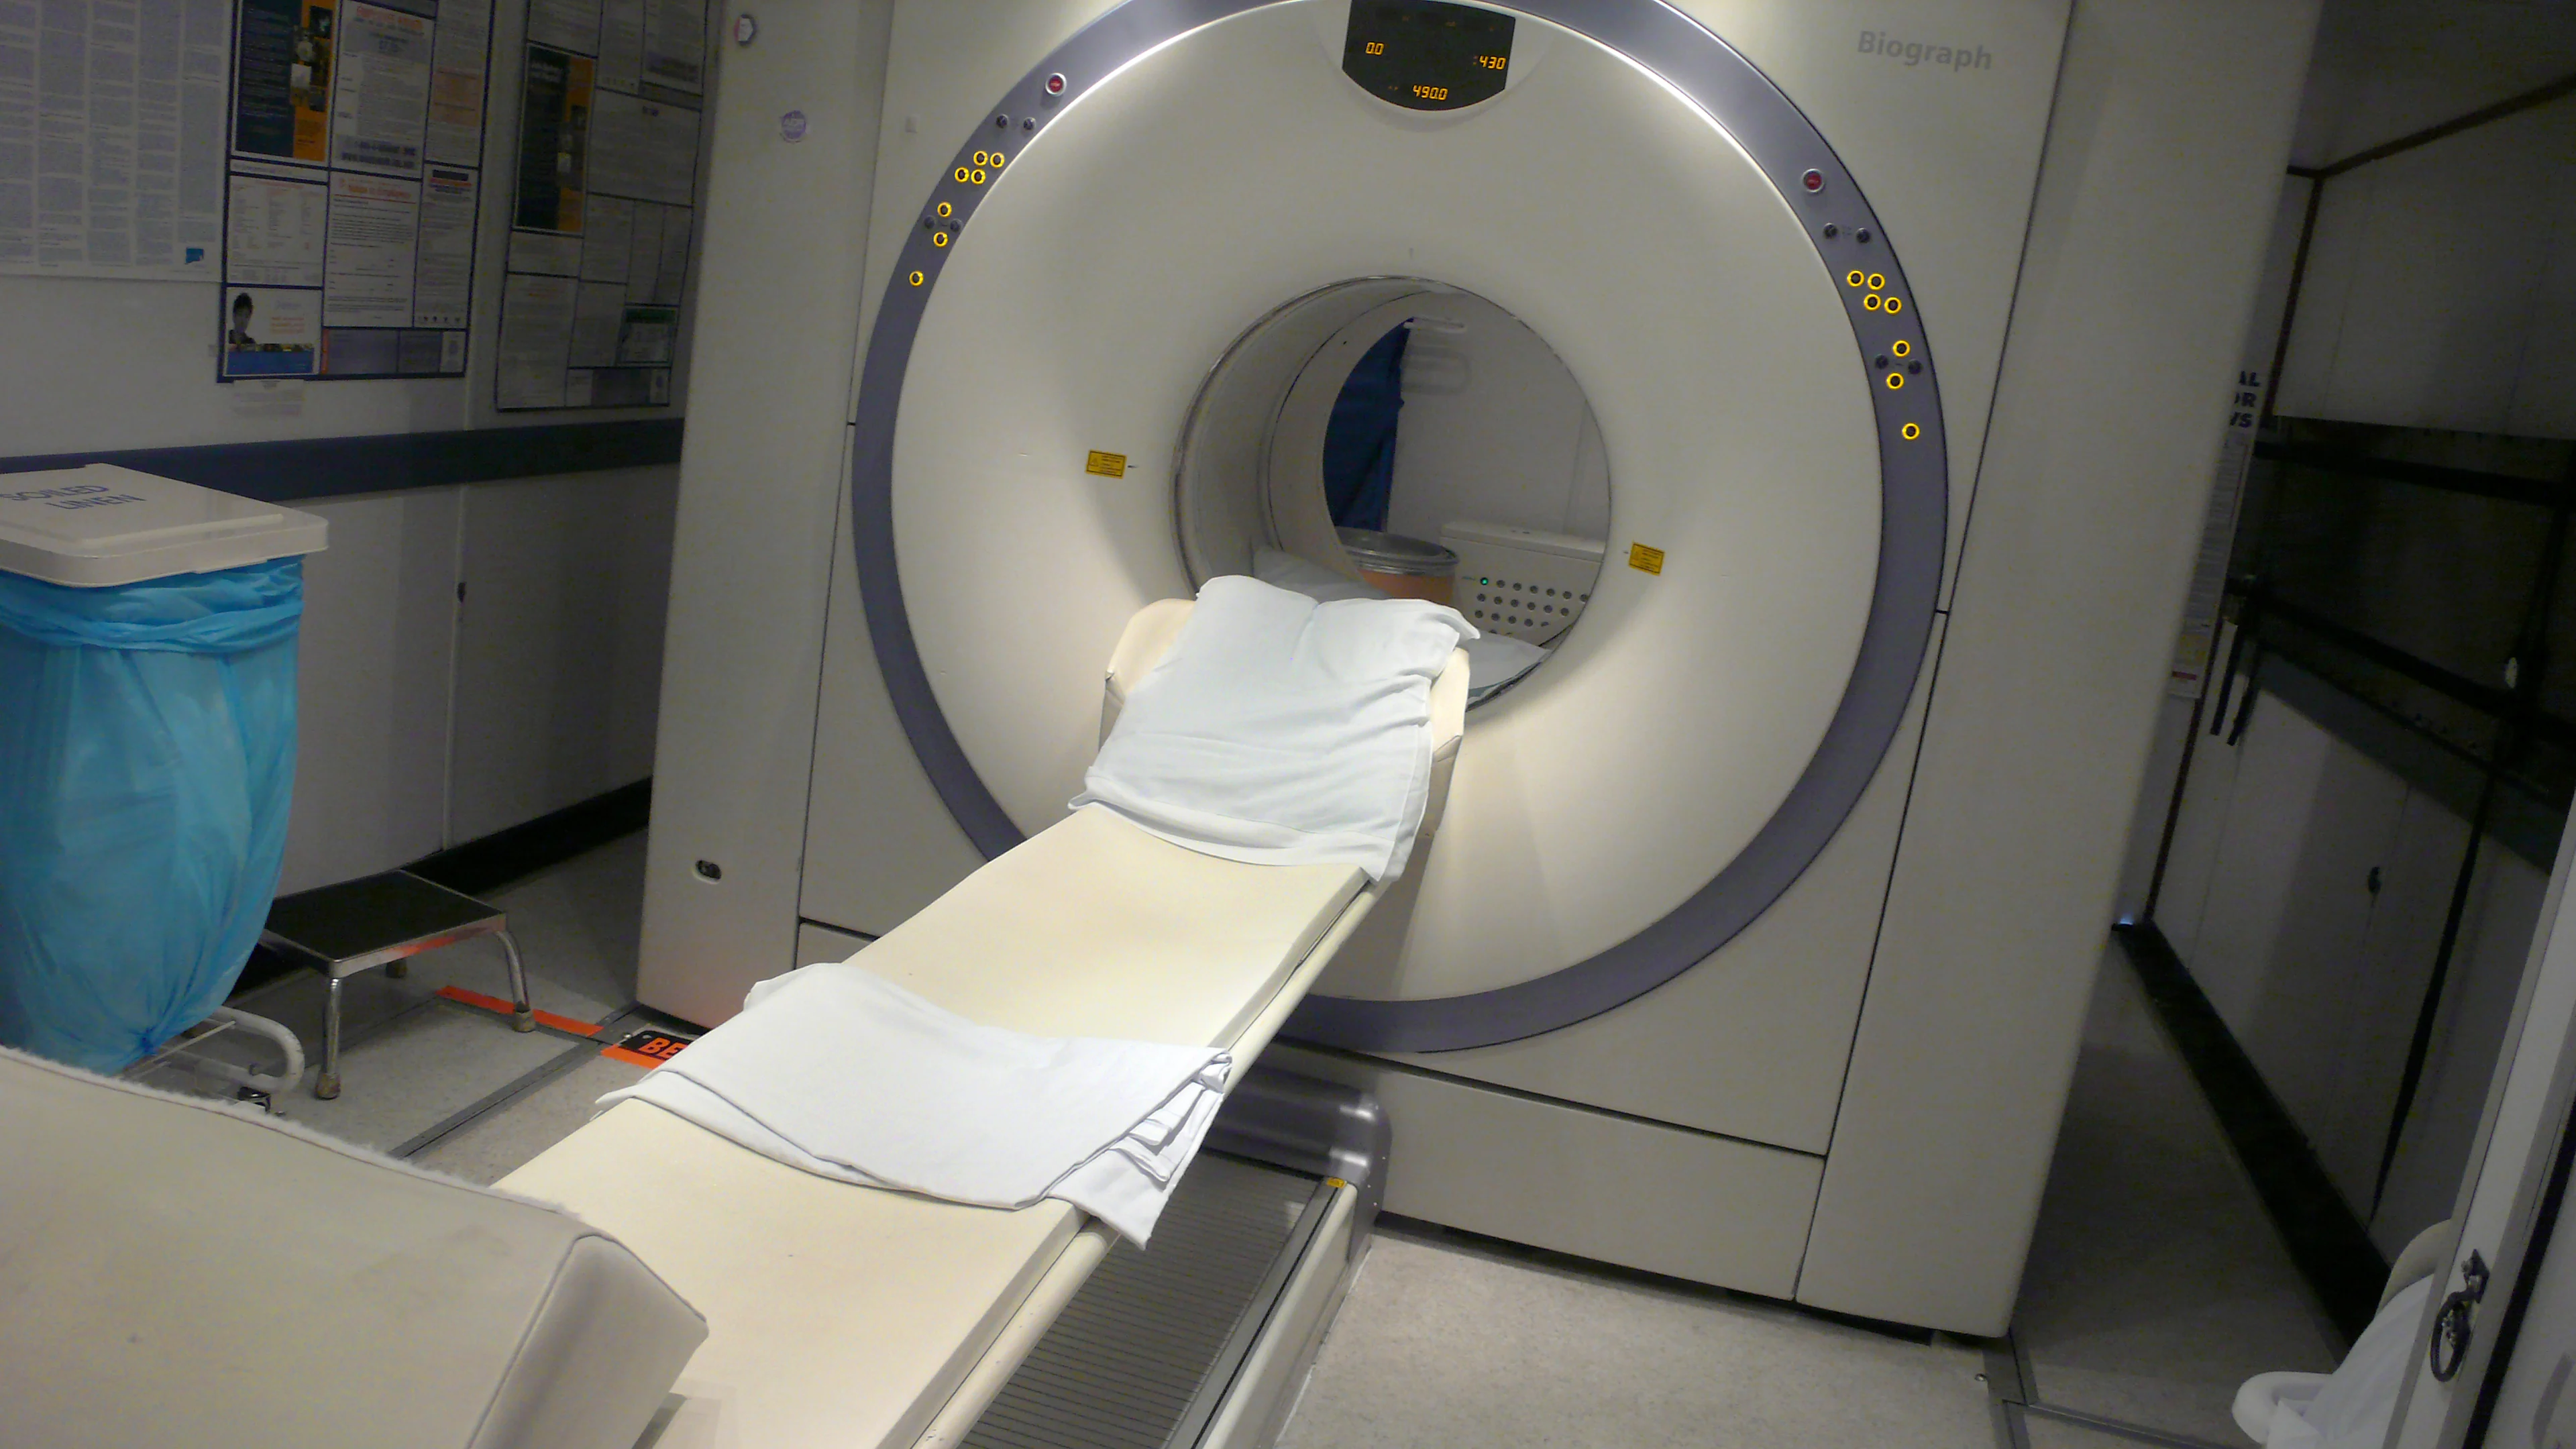
A ring of detectors around the patient registers photons. When opposing detectors record a suitable pair within a very short time window, the system records a and draws an imaginary line between them, called a line of response. One line does not reveal the exact point. From millions of lines at different angles, software reconstructs a three-dimensional tracer distribution. Scintillation crystals flash when struck by gamma photons, while electronics record event times and energies.
() PET measures the tiny difference between the arrival times of the two photons. If one reaches its detector first, the event probably occurred closer to that side. does not remove all uncertainty, but it narrows the possible position along the line and improves the signal-to-noise ratio of the image.
Jens Maus · Sources ↗
Video koji je dostavio autor
Why is PET so often combined with CT?
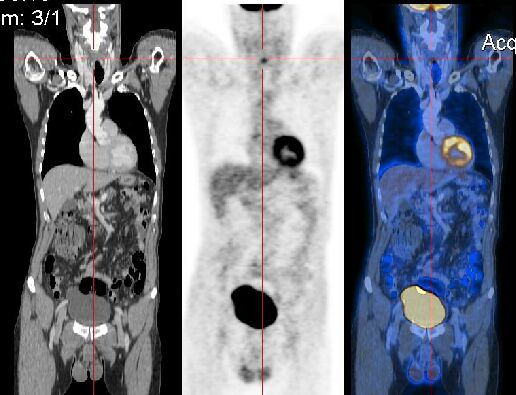
PET may reveal an area of strong tracer uptake, but without an anatomical map it can be difficult to decide whether the signal belongs to a lymph node, an organ or neighbouring tissue. In a hybrid PET/CT scanner, the patient remains on one table and passes through CT and PET components. Software aligns the scans and overlays metabolic activity on detailed CT anatomy; CT is usually acquired first. Clinicians can then assign a focus of activity to a particular structure.
CT performs another important job: correction. Some gamma photons are absorbed or scattered as they pass through tissue. Without correction, deeper parts of the body might look artificially less active on PET. CT estimates the tissues in the photons’ paths, and software uses this map to correct the PET data. Because CT X-rays have a different energy from PET photons, the CT measurements must be converted appropriately. Patient movement between scans can misalign the images and create misleading locations or intensities.
The CT scan may be low dose, chiefly for correction and localisation, or diagnostic and more detailed, sometimes using a contrast agent. Radiation exposure is therefore not the same for everyone. PET/MRI is available for selected indications and provides excellent soft-tissue detail, but it is less widely available and does not automatically replace PET/CT.
MBq · Sources ↗ · Image terms ↗
What happens during the scan, and what does it show?
Preparation depends on the tracer and the medical question. For a common cancer scan with , patients usually avoid food for several hours but may drink water; staff check blood glucose, medicines, diabetes, possible pregnancy and other relevant circumstances. Exercise on the previous day can raise muscle glucose use and alter the scan. Instructions for people with diabetes are tailored to their treatment and scan time; nobody should change insulin or other medicines on the basis of a general article online.
After an intravenous injection, a quiet uptake period of roughly 30 to 60 minutes usually allows the tracer to distribute. The patient then lies still while the table moves through the scanner. PET acquisition often takes around 20 to 30 minutes, though it may be shorter or longer. Avoiding speech and reading is particularly important for some brain scans; identical strict rest instructions do not apply to every examination. Staff give any necessary advice about fluids, urination and contact with others afterwards.
On a coloured PET display, warm colours denote greater accumulation of the selected tracer relative to the display scale. They do not automatically mean a tumour. The brain naturally uses a lot of glucose, heart-muscle uptake varies, and the kidneys and bladder often appear bright because they excrete . Clinicians assess the pattern, intensity, CT anatomy, previous scans and clinical history. The standardised uptake value, or SUV, helps comparison but is not a test that by itself separates benign from malignant findings; it also depends on timing and protocol.
Oncology: staging, treatment response and pitfalls
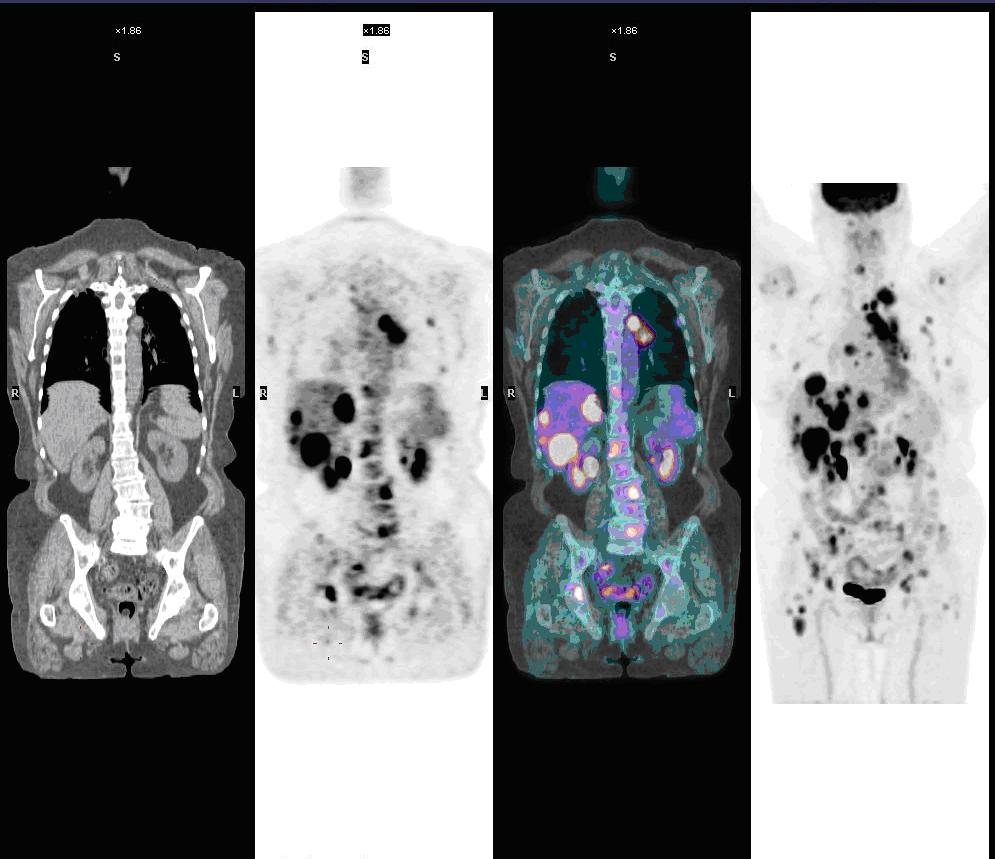
PET/CT is particularly useful for checking spread to lymph nodes or distant organs, assessing response to treatment and investigating suspected recurrence. Its role depends on the cancer type. In many -avid lymphomas it is part of standard staging and response assessment; it is also used in certain situations in lung cancer. In Hodgkin lymphoma, a scan after a defined number of treatment cycles may help guide the next step. For some lymphomas the compares uptake in suspicious sites with reference activity in the mediastinal blood pool and liver.
A mass may remain visible on CT after treatment while its signal has fallen markedly; active disease may have disappeared, leaving scar tissue. Conversely, a new bright focus does not prove recurrence: infection, postoperative inflammation, radiotherapy and immunotherapy can change uptake. Important or ambiguous findings may need another examination or a biopsy. PET does not replace microscopic tissue diagnosis.
The method is not equally sensitive for every cancer. Some tumours take up little , and microscopic deposits may lie below detection limits. For selected prostate-cancer questions, tracers bind to , a protein often overexpressed by cancer cells. The question then shifts from glucose use to the location of a molecular target. Whole-body PET is therefore not justified as routine screening of healthy people: incidental findings may lead to extra procedures and unnecessary radiation.
Myohan · Sources ↗ · Image terms ↗
Cardiology: blood flow and hibernating heart muscle
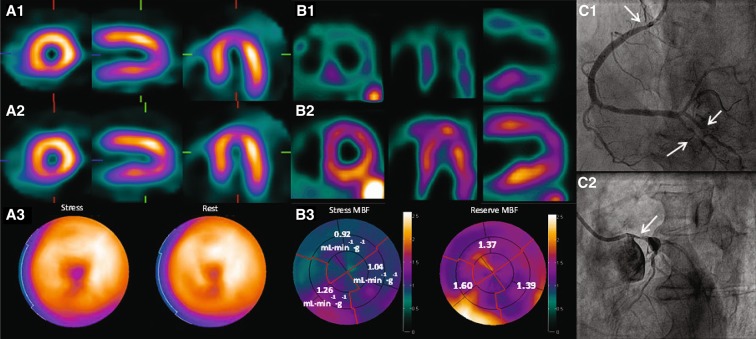
In the heart, PET is often used to measure : blood delivery to the heart muscle. Tracers including rubidium-82, nitrogen-13 ammonia and oxygen-15 water allow images at rest and during exercise or drug-induced stress. Comparing them reveals areas of myocardium that receive too little blood under stress. PET can also quantify overall flow and flow reserve, useful when the problem lies in small vessels rather than only a major narrowed coronary artery.
Another question is whether poorly contracting muscle after long-standing low blood flow has become permanent scar or still contains viable, hibernating tissue. Doctors compare with metabolism. Low flow with preserved uptake suggests some tissue may remain alive; low signals for both make scar more likely. This can help a decision about restoring blood supply, but it does not guarantee recovery after a stent or bypass. The patient’s condition, coronary anatomy and evidence for benefit all matter. PET also helps detect active inflammation in selected cases of cardiac sarcoidosis.
Driessen et al. · Sources ↗ · Image terms ↗
Neurology: different tracers answer different questions
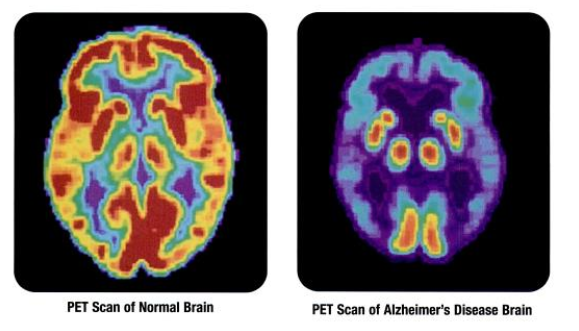
Brain PET maps patterns of glucose use. In some neurodegenerative diseases, particular regions become less active; together with examination, cognitive testing, MRI and other biomarkers, the pattern may help explain symptoms. In drug-resistant epilepsy, PET between seizures may reveal an area of reduced activity that guides further investigation before surgery. PET alone does not automatically identify the exact area to remove and cannot promise a cure.
Some specialised tracers bind amyloid deposits, while others target tau changes associated with Alzheimer disease. They should not be confused: Amyvid (florbetapir) is an amyloid tracer, not one that measures amyloid and tau simultaneously. A positive amyloid scan shows deposits but does not by itself prove they caused a person’s symptoms; some people without dementia also have them. These scans are ordered when the result may genuinely change diagnosis or treatment.
U.S. National Institute on Aging · Sources ↗
Radiation dose, limitations and the next generation
PET uses ionising radiation from the , while PET/CT adds the CT dose. The total varies with the tracer, injected activity, patient size and CT protocol, so one figure cannot describe every examination. Clinicians weigh likely diagnostic benefit against risk, tailor protocols and avoid unnecessary repeat scans. Pregnancy, breastfeeding and conditions affecting preparation should be discussed with the team in advance. A short isotope half-life reduces the duration of radioactivity; it does not mean there is no radiation.
A conventional PET ring covers only part of the body at one time, so the table moves in stages. Long-axial-field-of-view systems such as uEXPLORER capture much more of the body simultaneously and detect more useful photon pairs. Early work shows that this gain can provide a better image, a shorter scan, a lower injected activity or longer tracer tracking, though not every advantage at its maximum at once. Experimental protocols have obtained good images with very low activity or in roughly one minute; this does not make one-minute scans standard for every patient.
Watching tracer movement through many organs at once is especially valuable for research into drug distribution and clearance. is also developing: the same molecular target can first be imaged with a PET radionuclide and then treated with a different one attached to a similar carrier. This is already clinical practice for selected patients with -positive prostate cancer. Therapeutic radiation can still affect healthy tissue, so saying it hits only cancer cells would be misleading.
PET is most useful when answering a precise question: where is disease, how active is it, how is it changing under treatment, or what is an organ’s blood flow? The answer requires joint interpretation of the physical signal, CT or MRI anatomy, previous findings and clinical context. This is why PET is a powerful medical tool, and why one bright spot is never an entire diagnosis.