What is happening?
launched and Sentinel-3C on a Vega-C rocket on 15 September 2026. Both deployed and made contact with ground control.
A European Vega-C rocket carried two different satellites from French Guiana on 15 September 2026. Sentinel-3C was released into orbit first and about an hour later. 's control centre then received a signal from each spacecraft. That confirms they separated from the rocket and made contact; it does not mean all scientific measurements have already begun.
How and why?
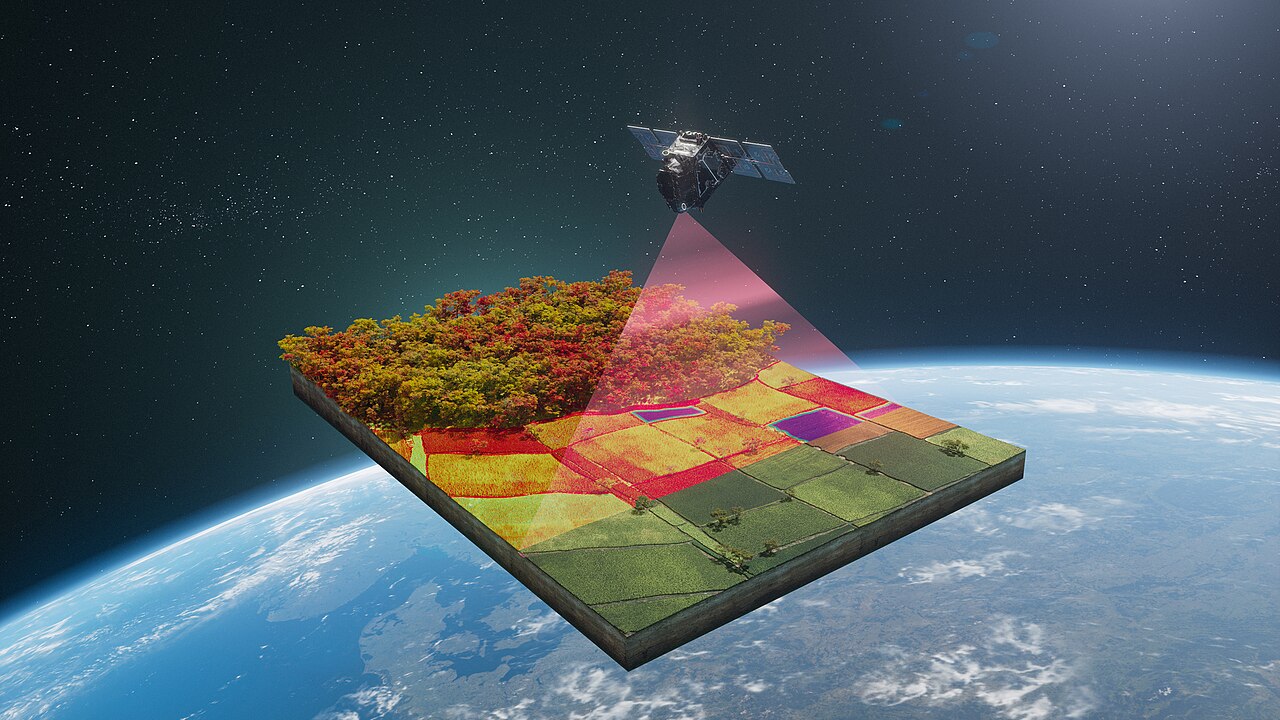
is designed to measure the faint glow plants emit during photosynthesis. Sentinel-3C continues observations of land and oceans.
will measure the extremely faint light plants emit while using sunlight in photosynthesis. The glow is invisible to our eyes, but an instrument can reveal how efficiently vegetation performs this process and how it responds to stress. Sentinel-3C has a broader task: monitoring land and ocean surface temperatures, ocean colour, ice, vegetation and inland water levels.
How do we know?
confirmed the launch and the first signal from each satellite. Scientific measurements will follow initial checks.
reported the launch time, deployment order and first signals. Engineers must next check the instruments during the early orbital phase. Only then can data routinely support research and Earth-monitoring services. It is important to distinguish a successful launch from proof that instruments will deliver reliable measurements over time. Calibration, comparison with other data and continuing quality checks are still required.
Why does it matter?
Continuous satellite observations help researchers track changes on our planet.
The satellites' data can help track changes in vegetation, oceans and ice, as well as the effects of drought or warming. The Sentinel-3 series provides continuity: detecting long-term change requires observations over many years. adds a specialised view of how plants function, helping researchers study links between photosynthesis, carbon and water.
How can a satellite see photosynthesis?
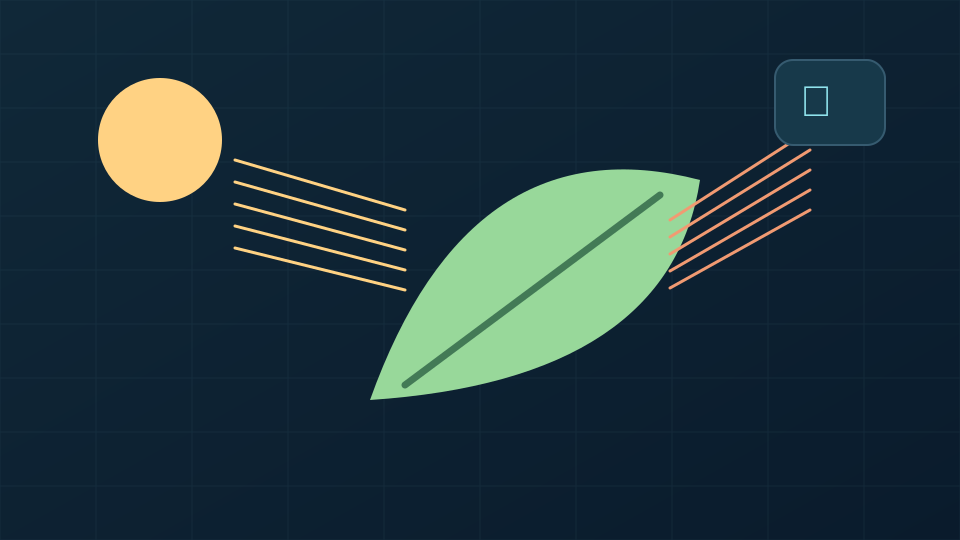
A plant absorbs sunlight with chlorophyll but does not convert all the incoming energy into chemical energy. A tiny portion is emitted again as faint fluorescent light. was designed to measure this signal from orbit. It does not directly count sugar molecules made by leaves; researchers must connect with plant physiology, vegetation type, illumination and atmospheric conditions. Ground measurements are essential for calibration.
Sentinel-3C observes a wider range of variables, from surface temperature to ocean colour. Combining its measurements with allows researchers to ask how drought or heat changes plant function, rather than just how green a region looks. Two forests with similar colour might use light with different efficiency. Clouds and seasonal changes complicate interpretation, however; one map cannot establish the cause of stress on its own.
Launch is followed by instrument checks, adjustments and comparison with known references. Only after engineers and scientists confirm that measurements are stable can the data support long-term conclusions. Continuity also matters: researchers can separate instrument changes from real ecosystem changes only if they understand differences between satellites and compare several seasons.
Original NZM illustration · Sources: ESA
A further detail
occurs when a chlorophyll molecule returns part of the energy it absorbed as light of another wavelength. The signal can be measured from a leaf in a laboratory, but viewing a region from orbit introduces clouds, shadows and varying angles. therefore uses precise spectral measurements, which researchers compare with observations on the ground. The useful question is not merely whether a forest looks green, but how it functions in a dry year compared with a wet one. A single image still cannot directly calculate all biomass growth or predict every field’s crop yield. Models must account for plant species and local conditions.
If the satellites provide a consistent record over years, researchers can compare how forests and crops respond to different droughts. A change in does not automatically have the same cause everywhere. Satellite maps therefore need to be read alongside weather and ground measurements.
Key terms
— faint light emitted after a material absorbs energy.