
What did satellites actually see?
Researchers have tracked when Arctic sea ice begins to melt and refreezes since 1979. A new analysis through 2023 finds that the season is now about 40 days longer than at the start of the record. Most of that increase happened before 2010. Since then, the average length has not kept rising at the same pace.
That is surprising because Arctic air continues to warm rapidly. Scientists are not calling it an ice recovery. Instead, the balance between influences has shifted. Storms, clouds and winds can lengthen the season in one year and shorten it in another. A single year and a long-term trend answer different questions.
Why did the season grow so quickly before?
When bright ice retreats, it exposes darker seawater. The water absorbs more sunlight, warms and takes longer to freeze in autumn. This feedback strongly lengthened during the 2000s. The study finds that later autumn freeze-up contributed more to the long-term change than progressively earlier spring melt.
After 2010, different cloud patterns reduced the sunlight reaching parts of the Arctic Ocean. That can temporarily weaken the increase in season length. Yet today’s ice is thinner and younger than the multiyear ice that once dominated. It remains sensitive to year-to-year weather.
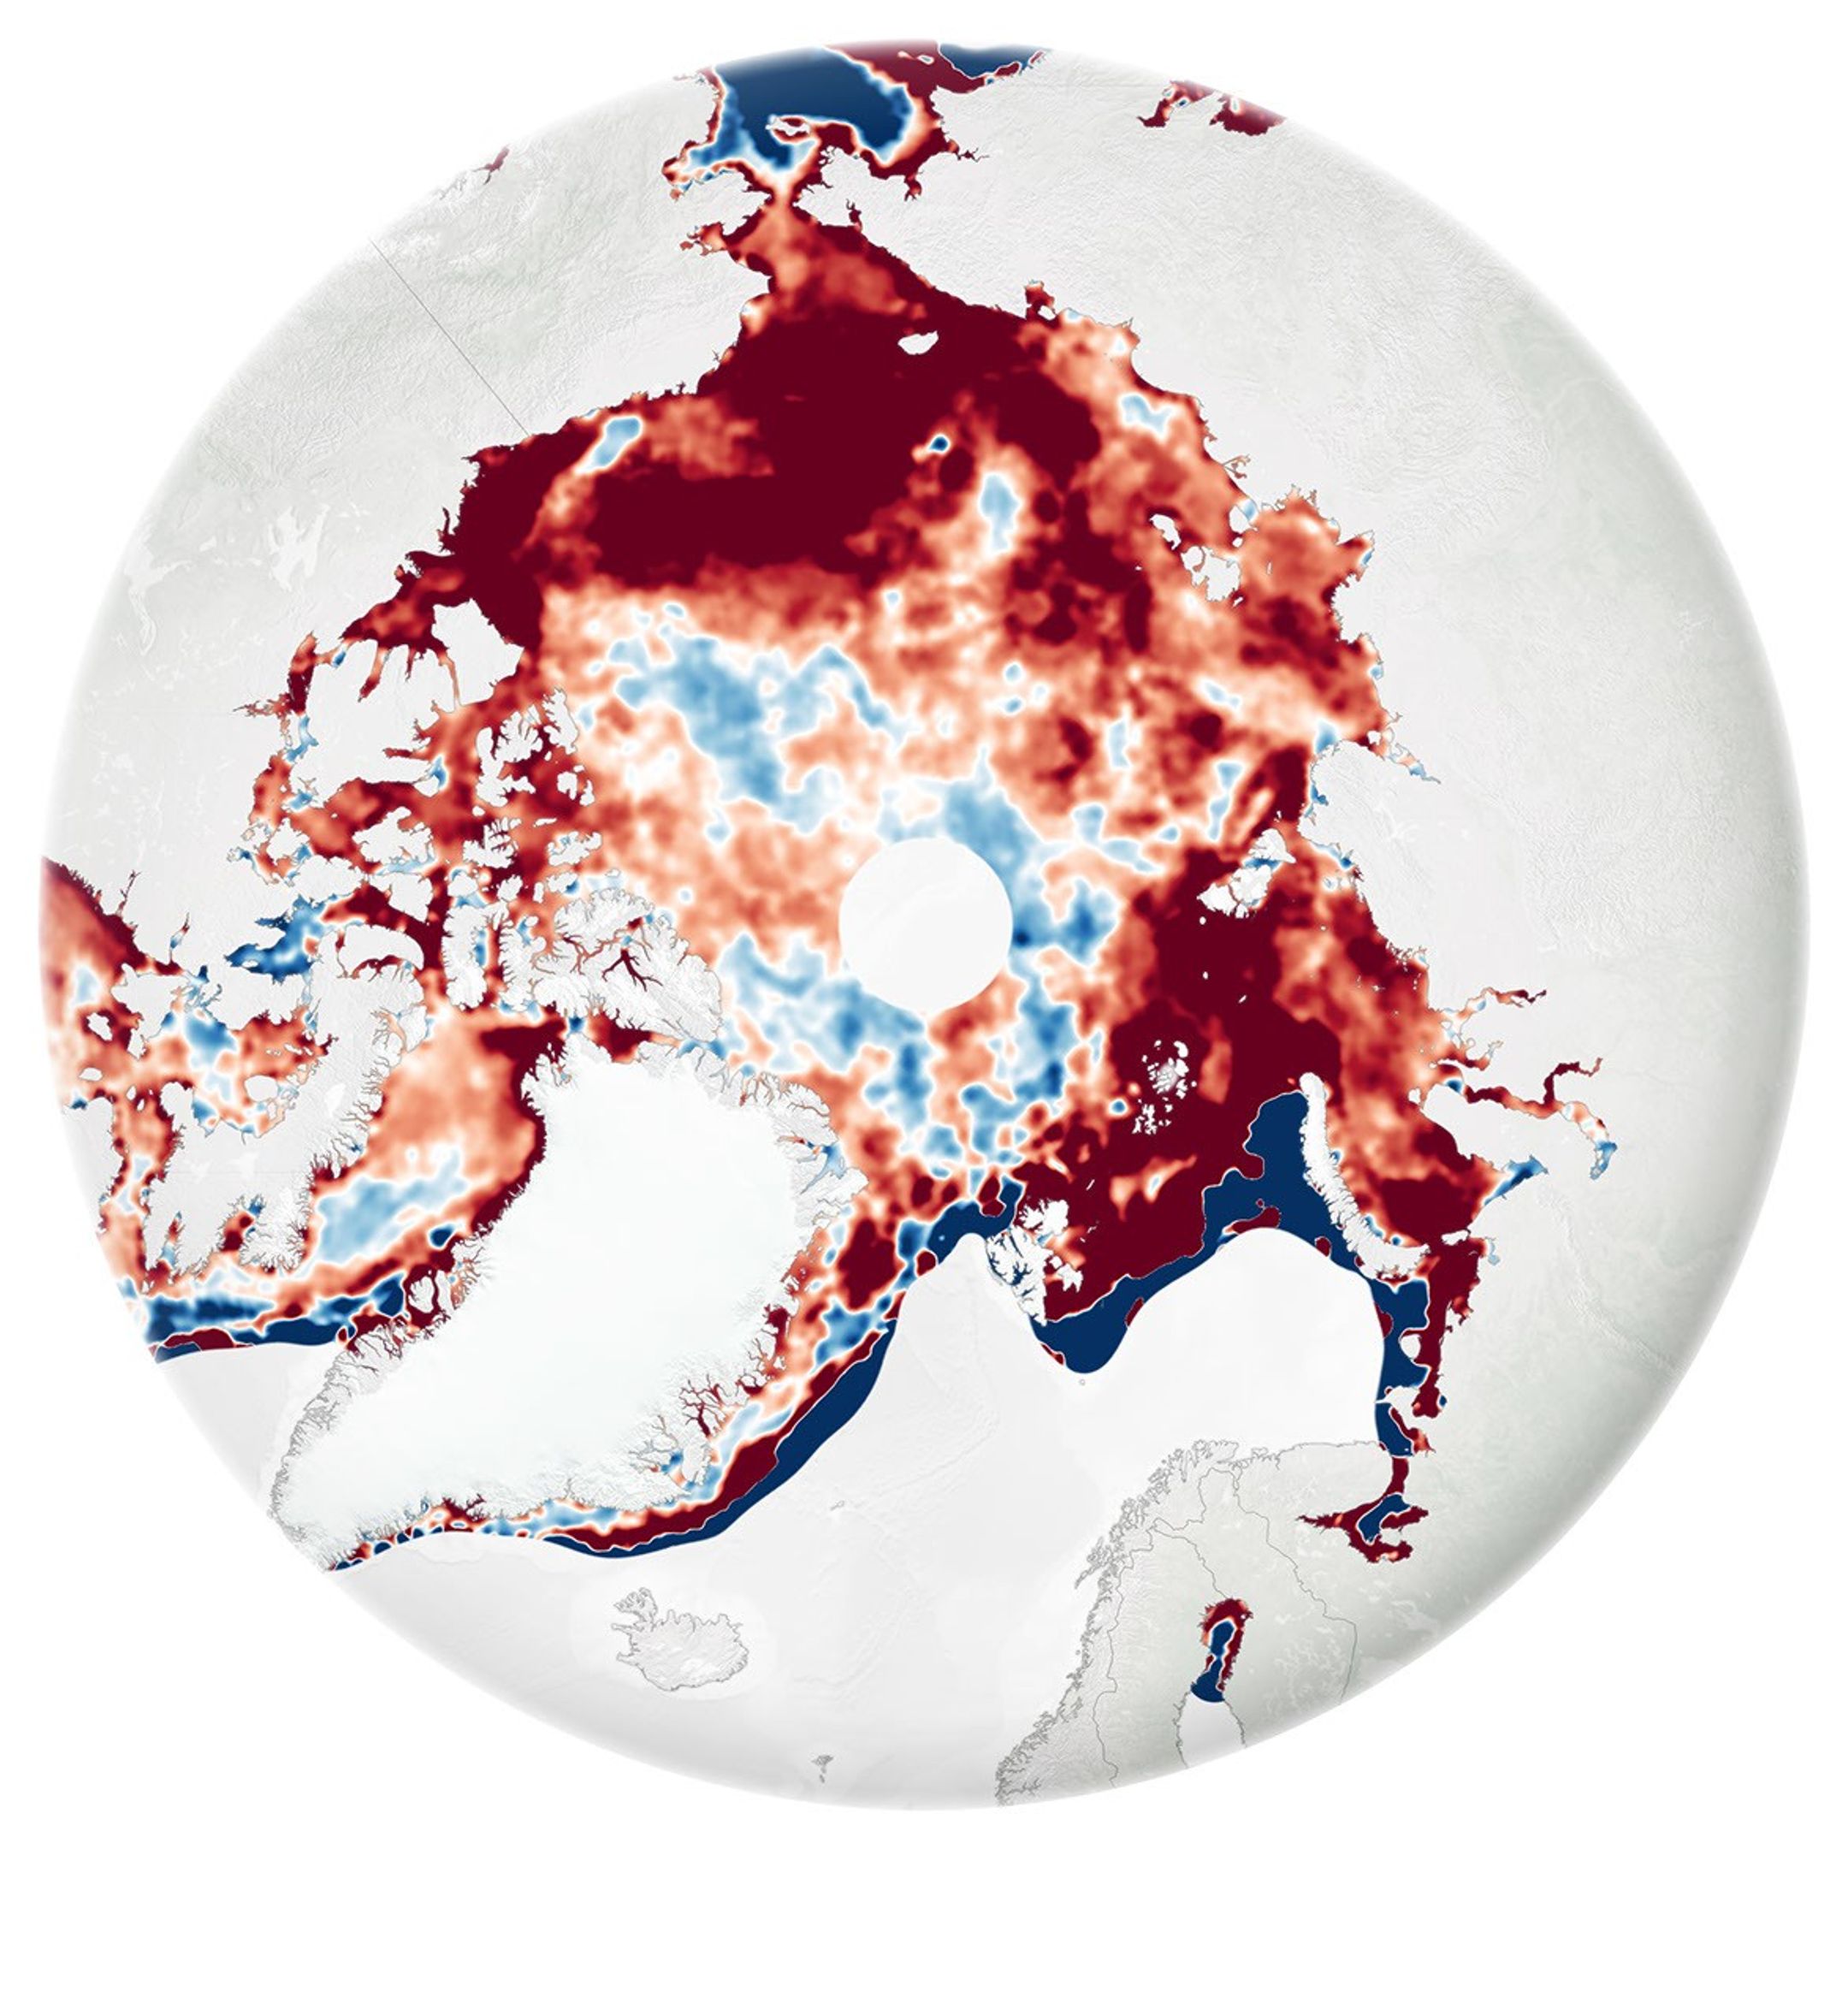
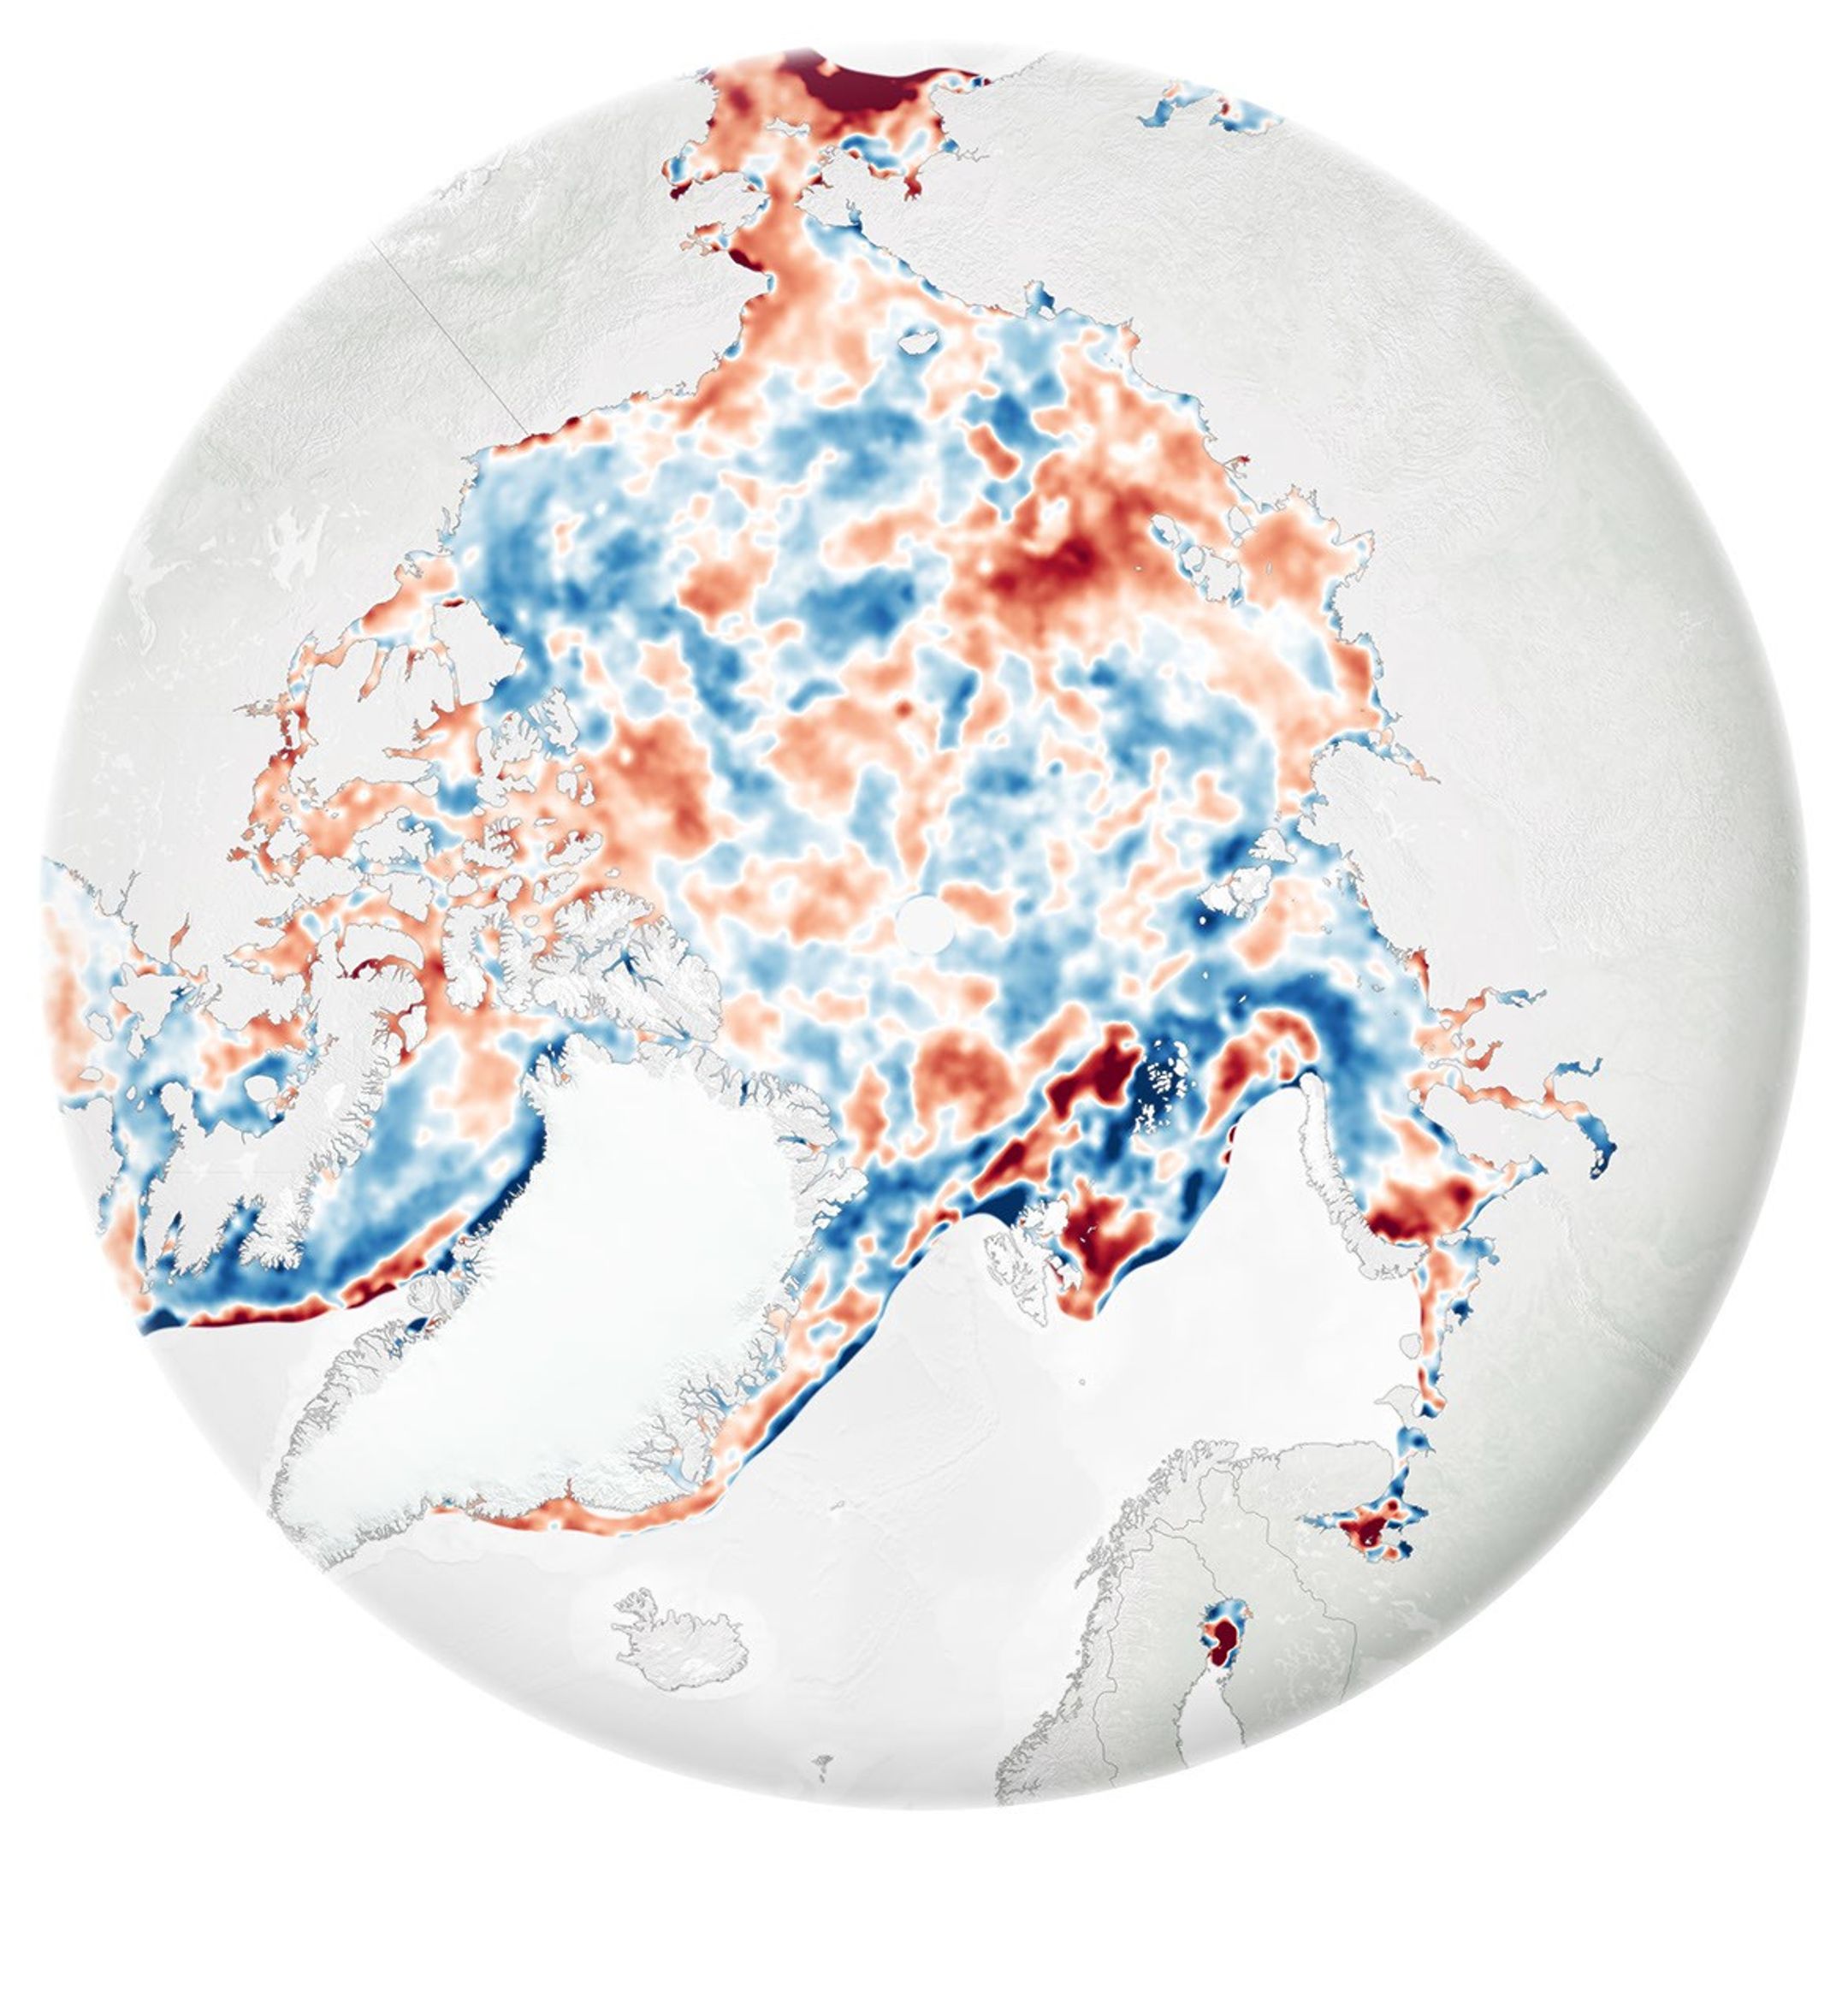
NASA Earth Observatory / Michala Garrison · Sources ↗ · Image terms ↗
How was the finding checked?
The team assembled a long series of satellite observations and compared melt onset with refreezing. On ’s maps, red marks places where the season grew longer and blue where it shortened. The map for the 2000s is mostly red; the later map is more mixed. This contrast shows a change in the rate of growth, not a return of thick ice.
Researchers also examined the Arctic energy balance: heat arriving from the Sun, atmosphere and ocean, and heat leaving for space. That matters because similar changes in season length can have different causes. The measurements cannot yet tell us whether the pause will last.
What does the result not mean?
The Arctic is still warming much faster than the global average, and its remaining sea ice is thinner than it was decades ago. Overall, the remains far longer than in 1979. A pause in further lengthening does not reverse ice loss or show that climate change has ended.
Scientists warn that the pattern could shift again, especially if thicker ice north of Greenland and the Canadian Arctic Archipelago continues to thin. Continued satellite monitoring will help distinguish a temporary pause from a more persistent change.
Why season length and ice quantity differ
The start of melting, the end of freezing, ice-covered area and thickness are separate measurements. Two years can have similarly long yet leave very different amounts of ice in late summer. Thinner floes break more readily and react faster to wind and warm water. Researchers therefore combine melt timing with measurements of ice extent, age and thickness. No single indicator replaces the others.
An important feedback links surface colour with absorbed energy. Snow and ice reflect much sunlight, while open ocean absorbs more. But clouds can both shade the sea and trap heat in the atmosphere; their net effect changes with season, location and height. Seeing a decade when the lengthened more slowly does not identify the cause of every individual year. Energy-balance and weather analyses are needed.
When reading this result, check the beginning of the record and the quantity being measured. Compared with 1979 the season remains substantially longer, even though its average growth slowed after 2010. Researchers will keep observing whether this is a durable shift or temporary variability. Openness to new data is not a weakness; it prevents one surprising result from being interpreted too broadly.

Original NZM illustration · Sources: NASA
A further detail
Arctic sea ice floats, so its immediate melting does not raise sea level in the same way as melting land ice. Losing the bright cover still changes how much solar energy the ocean absorbs and can affect weather, ecosystems and navigation. When ice is thinner, the same wind can break and move it more easily, changing its extent rapidly. Satellite melt onset is often identified from changes in microwave radiation emitted by the surface; no observer sees the first drop of water on every floe. The threshold definition therefore has to remain consistent across decades. Researchers also test how much the finding changes if the threshold or study region is adjusted. Such robustness checks help show whether the pause is a stable result or partly a methodological choice. Scientists do not claim every Arctic region behaved identically: the map can show longer and shorter seasons at the same time.
Both findings belong in the conclusion: the average increase in season length slowed, and the Arctic remains much warmer with less old ice. Hiding either fact would give a poorer picture. More years of observations will help establish how persistent the pause is. Satellite observations need consistent definitions and continued cross-checking with other measures of ice conditions.
Key terms
— the time between the start of spring sea-ice melt and autumn refreezing.