
What does the longest record show?
The international team assembled the longest comparable record yet of change in the Greenland and Antarctic ice sheets. Together they lost about 11.3 trillion tonnes of ice between 1979 and 2023. That water contributed roughly 3.14 centimetres to global sea-level rise. The figure sounds small until it is spread across the immense area of the oceans.
Greenland contributed around 1.81 centimetres and Antarctica 1.33 centimetres. Annual swings must be separated from a decades-long trend. Loss slowed temporarily in some recent years, but the overall mass balance of both ice sheets remained negative.
Ice does not disappear only through surface melting
It is easy to picture puddles on the ice surface. Yet the study estimates that about 84 per cent of the total loss occurred as glaciers sped up and discharged more ice into the sea. Surface melting accounts for the rest. Pine Island and Thwaites Glaciers in West Antarctica are watched especially closely.
Ocean water can warm the underside of floating ice. If that supporting ice weakens, ice inland may flow toward the coast more easily. Summer air temperature or a single coastal photograph therefore cannot tell the whole story of an ice sheet.
How do we measure trillions of tonnes?
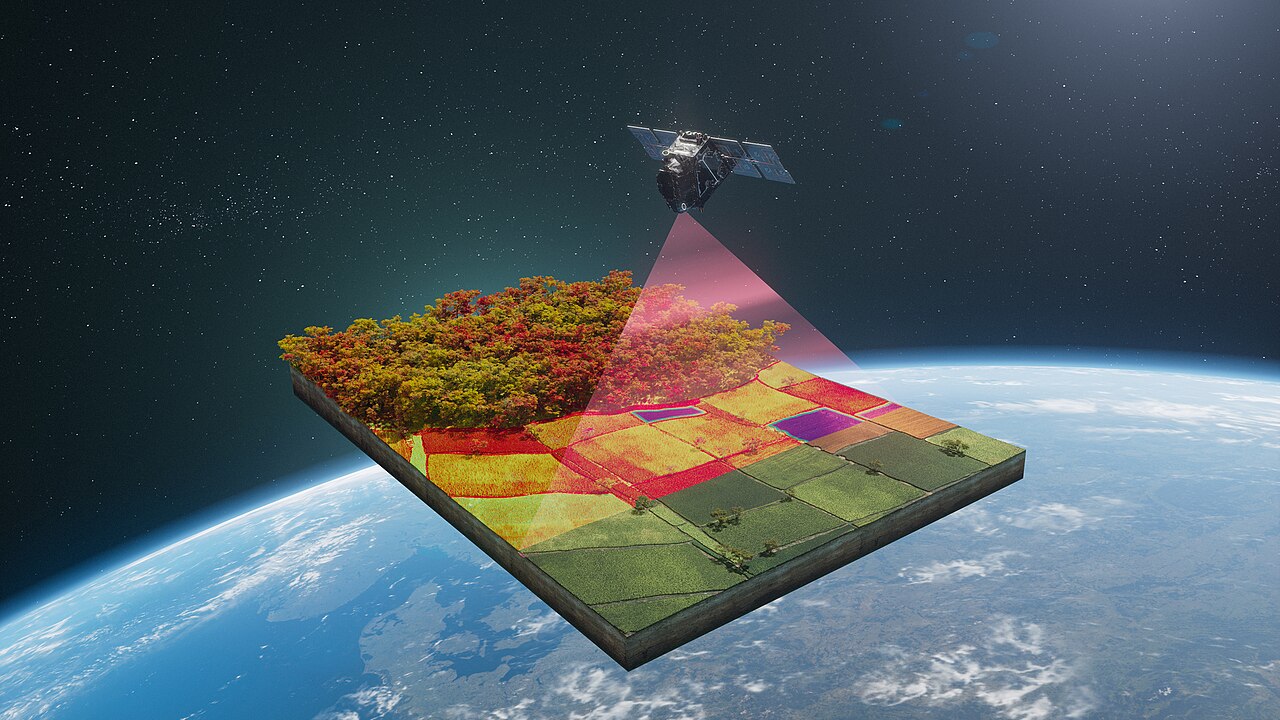
No satellite measures everything. Some instruments track surface height, others changes in gravity, while radar and optical sensors follow glacier motion. reconciled 42 independent surveys drawing on 27 satellite missions. That helps separate differences between instruments from real changes in ice.
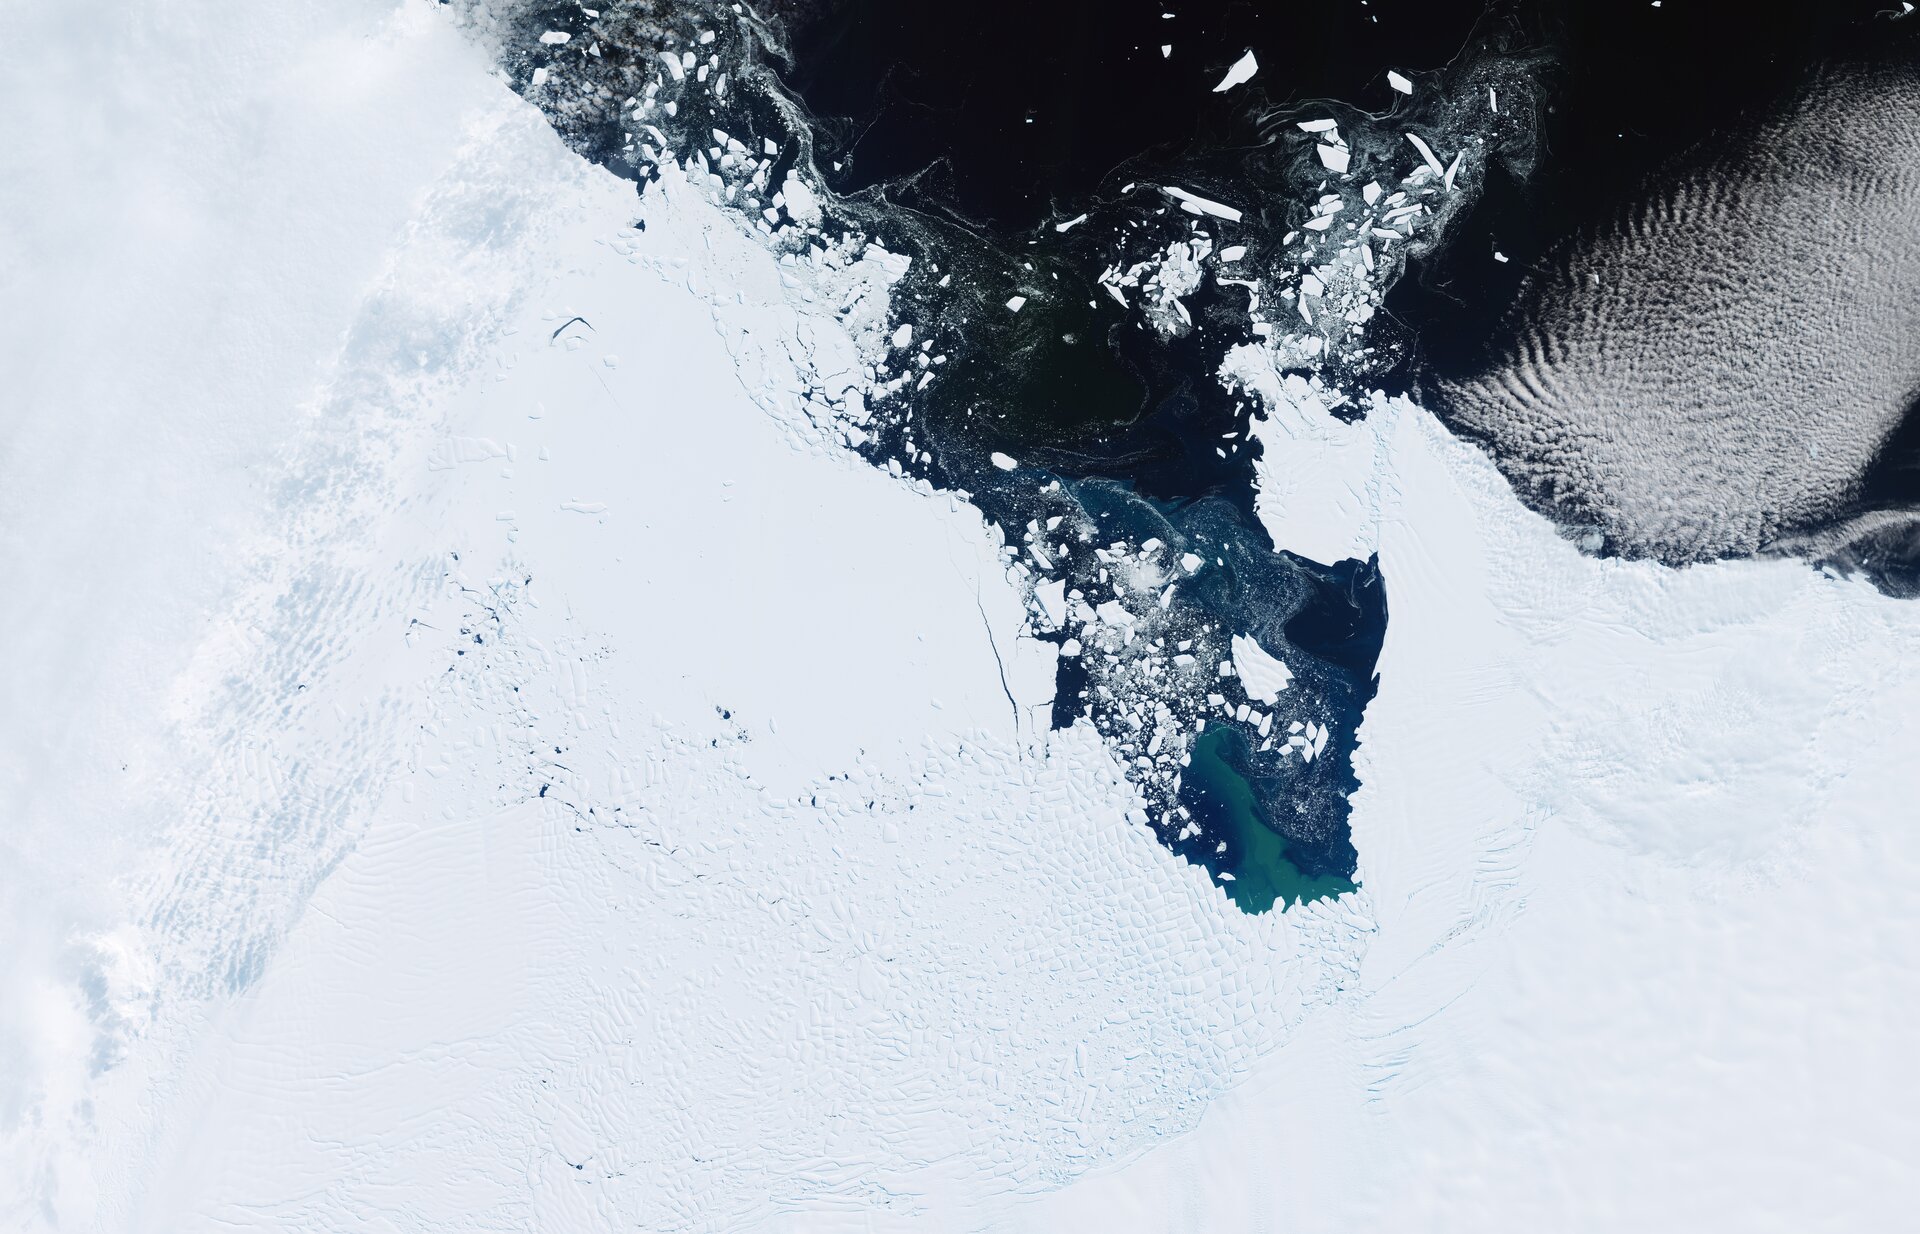
The Greenland record reaches back to 1972 and the Antarctic record to 1979. Long series matter because a few snowy winters or cooler summers can hide persistent loss. The accompanying 2026 image of Thwaites was taken after the study period: it illustrates a glacier but is not, by itself, evidence for the calculated loss.
Why do a few centimetres matter?
Rising seas increase flood and erosion risks, especially when high tides combine with storms. The researchers estimate that just over three centimetres may put millions more people at risk. The effect depends on location, coastal defences and other changes, so this is not a forecast for every shoreline.
Most importantly, the measurements improve models of future sea-level rise. Understanding how glaciers respond to warmer oceans helps us judge what might come next. A short-term slowdown does not erase decades of accelerating ice loss.
Why a centimetre of global average is not trivial
Global sea level is an average height across the ocean’s enormous area. Adding water from land ice raises that baseline, and high tides and storm surges occur on top of it. A few centimetres can therefore change how often water crosses a local flood threshold. Impacts vary: land rises or sinks in different places, currents redistribute water and coastal defences differ between towns.
An ice sheet can lose mass without dramatic melting on its surface. A glacier is moving ice: as it flows faster into the sea, it exports ice that may have accumulated inland over centuries. A floating ice shelf can act as a buttress that slows the flow. If warm seawater thins it from below, land ice can accelerate toward the coast. Measuring glacier speed is therefore as important as recording air temperature.
combines independent satellite techniques, but the synthesis still has uncertainties. Surface height is converted to mass using assumptions about snow density; the gravitational signal must be separated from other changes; flow estimates require ice-thickness maps. Agreement between methods strengthens confidence in the trend. A photograph of one glacier helps us picture a place but cannot replace a decades-long mass balance.
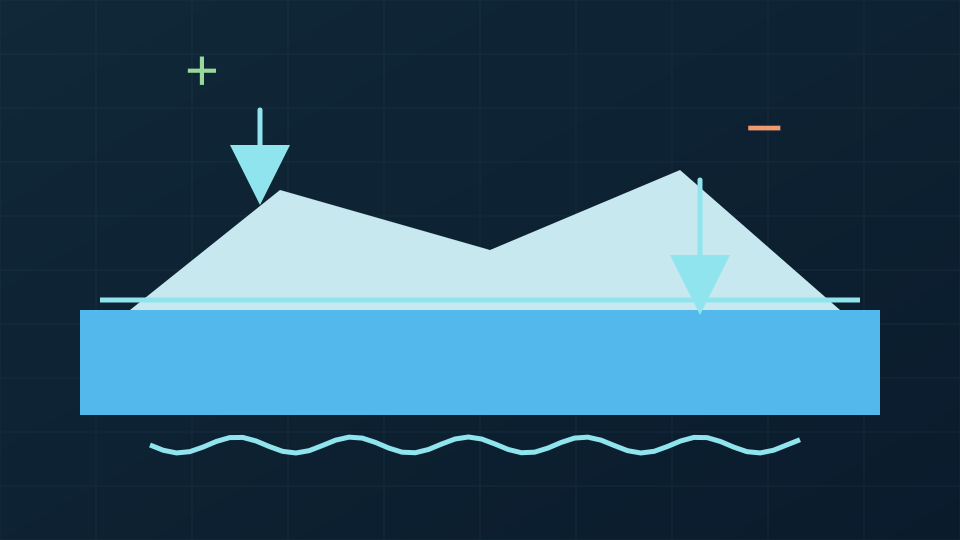
Original NZM illustration · Sources: ESA
A further detail
It helps to distinguish sea ice, floating ice shelves and ice still resting on land. Sea ice already displaces water, so its melting has little immediate effect on global sea level. Land ice adds new water when it reaches the ocean. A floating shelf is already at sea but can restrain a glacier behind it; its loss may indirectly accelerate land-ice contribution. Speed therefore matters alongside total mass. Two similarly sized glaciers can affect future sea level differently if one accelerates and the other remains stable. Satellites repeatedly measure position and height, while models test how the ground beneath the ice, friction and ocean heat influence flow. Future projections are not simply a straight-line extension of the past: they depend on warming, glacier behaviour and possible changes in stability. Scientists provide scenarios and ranges rather than one certain number for every coastline.
Centimetres of global average rise cannot be assigned unchanged to every beach. Local planning also considers tides, storms, land elevation and changing currents. The global ice balance provides a foundation, but a particular coast needs additional study.
Key terms
— the difference between snow that stays on an ice sheet and ice that leaves it.