
What does the new image show?
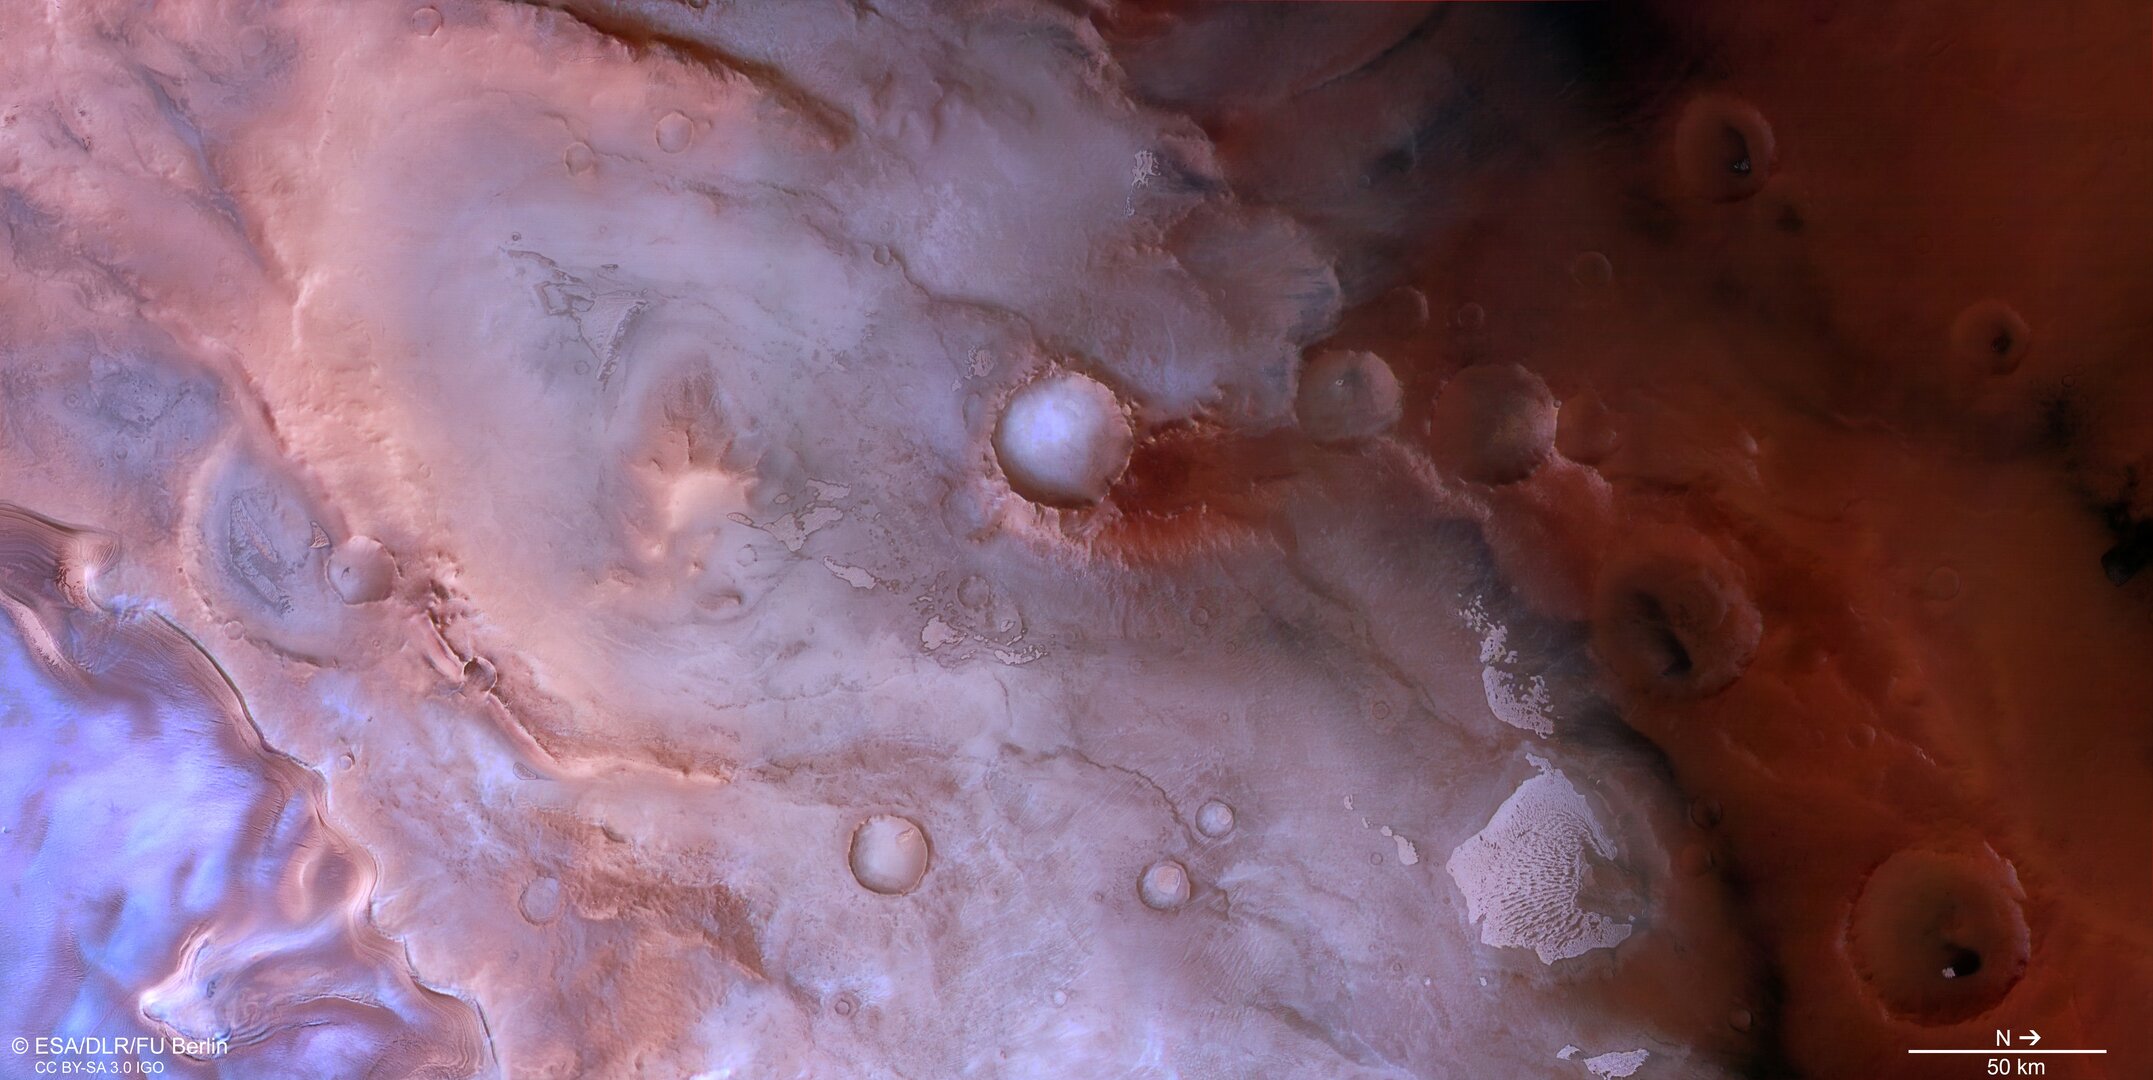
Europe’s Mars Express spacecraft photographed Thyles Rupes near the Martian south pole on 17 February 2026. Light and dark bands wind across the scene, while plateau edges form cliffs over a kilometer high. It looks almost like abstract art, yet each curve reflects real changes in surface composition, lighting or shape.
The scene is not one uniform substance. Brighter areas may include dust and carbon-dioxide frost; darker patches contain minerals that reflect less light. The angle of sunlight and the way camera channels are combined also affect the displayed colors. The purple hue is therefore not evidence of a biological process.
How do layers and cliffs form?
Martian polar regions change with the seasons. In cold periods carbon dioxide from the air settles as frost; in warmer periods it becomes gas again. Wind moves dark dust, depositing it in hollows or removing it from higher ground. Repeated cycles can emphasize layers and create bands visible from orbit.
Steep edges show where erosion or geological history has cut across the terrain. One image alone cannot establish the complete sequence. Scientists compare the photograph with a height map, older pictures and data on surface composition. An interpretation grows stronger when several kinds of observation show the same feature.
ESA/DLR/FU Berlin; CC BY-SA 3.0 IGO · Sources ↗ · Image terms ↗
What does the height map add?
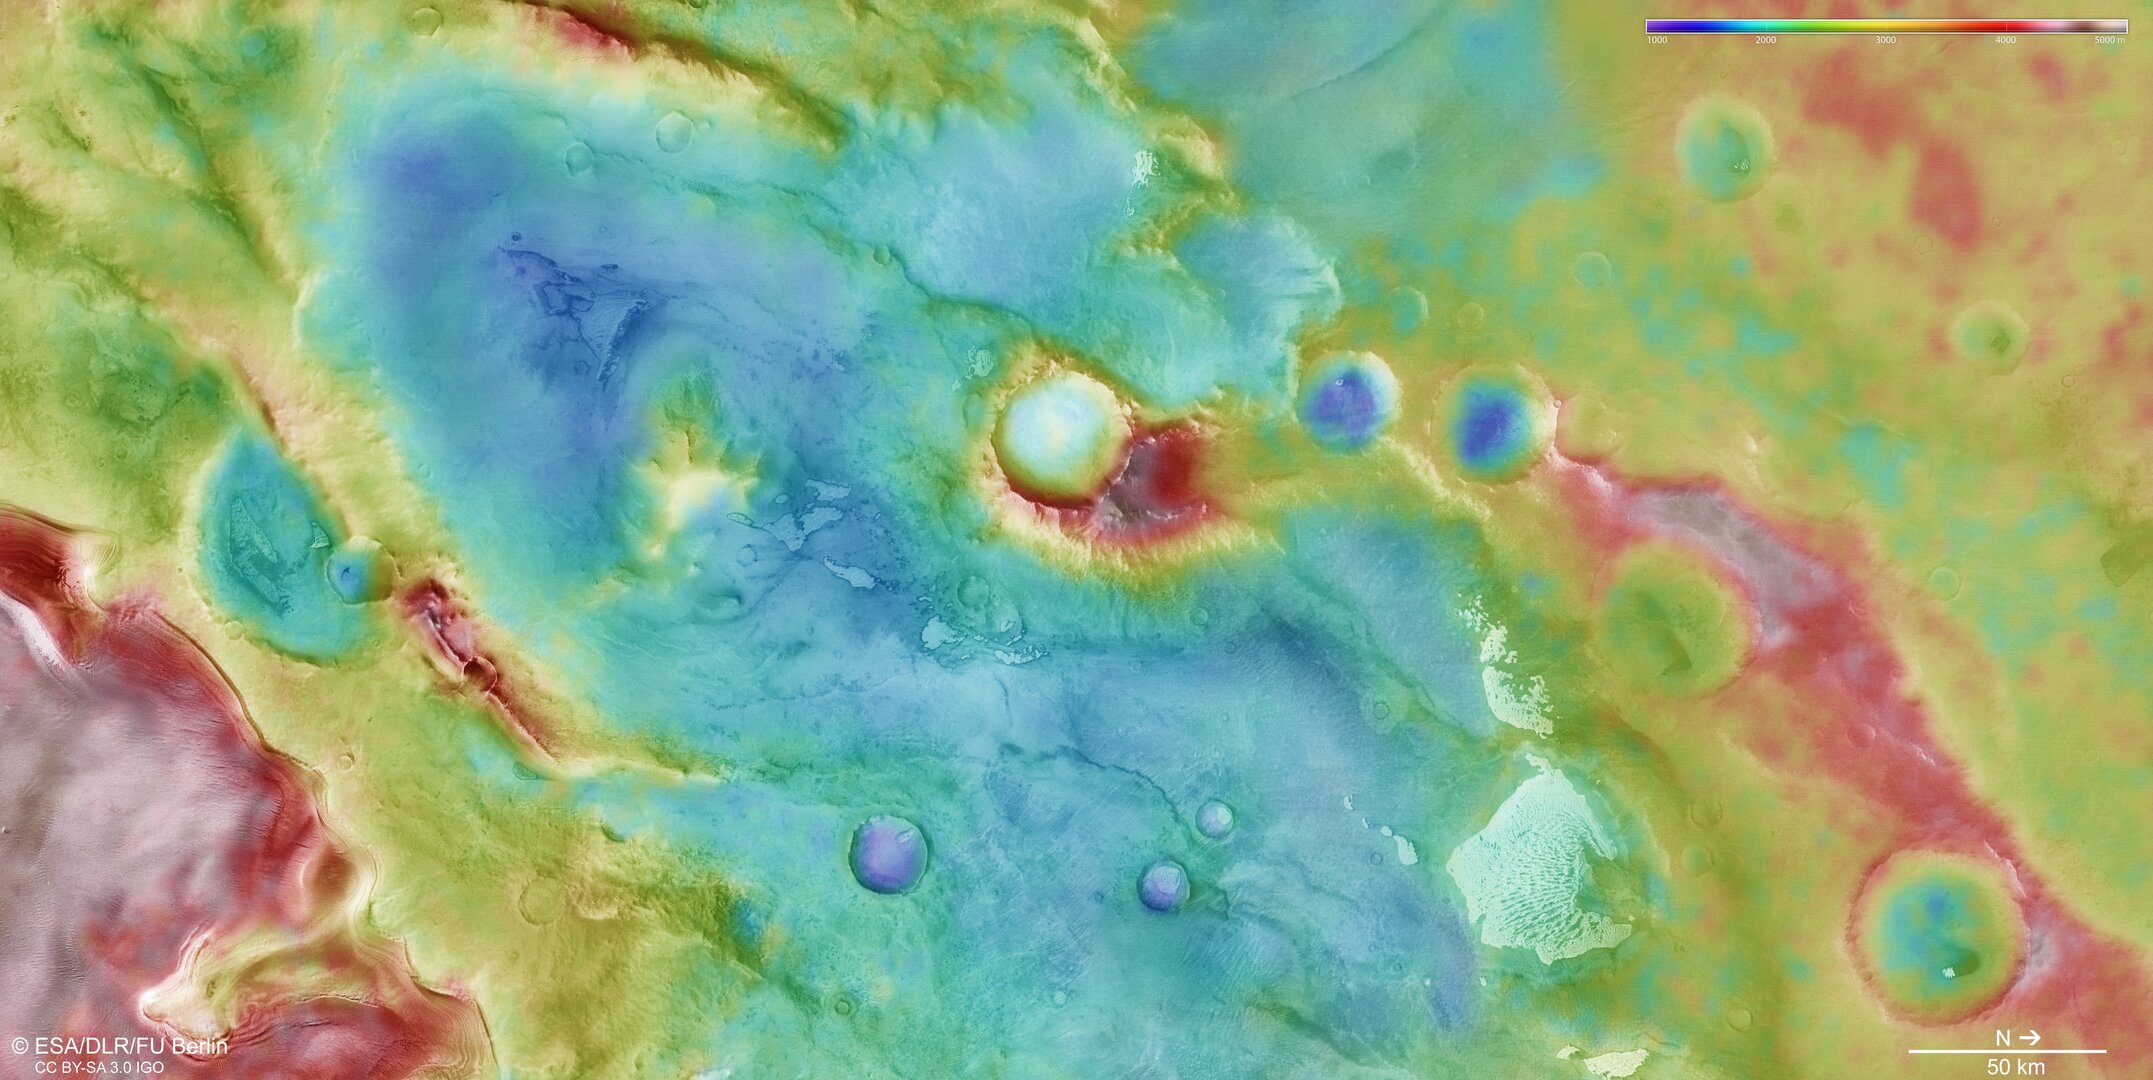
The accompanying this story uses colors for elevation, not Mars’s natural colors. It helps distinguish dark material in a valley from a shadow on a steep slope. It also shows how abruptly the terrain drops and which direction ridges run.
Mars Express’s camera views the surface from several angles during a pass. Differences between those views can build a model of relief, much as our two eyes estimate depth. Combining color, shape and height yields a fuller picture of the processes shaping the surface.
Why is it useful?
The image adds detail to maps of Mars’s polar landscapes. Layers may preserve clues about past climate and the movement of frost over time. Reading those clues correctly requires many observations and tests of possible causes. The scientific question is not just which color we see, but which processes made it.
How should we read colour in a planetary image?
A camera measures light through several filters, and a processed composite can amplify differences that human eyes would struggle to see. On Mars, dark mineral sand, lighter dust, ice and shadows may create similar patterns for different reasons. One pixel’s colour is therefore not a chemical analysis. Researchers compare it with spectral data, terrain shape and seasonal change to separate material from lighting.
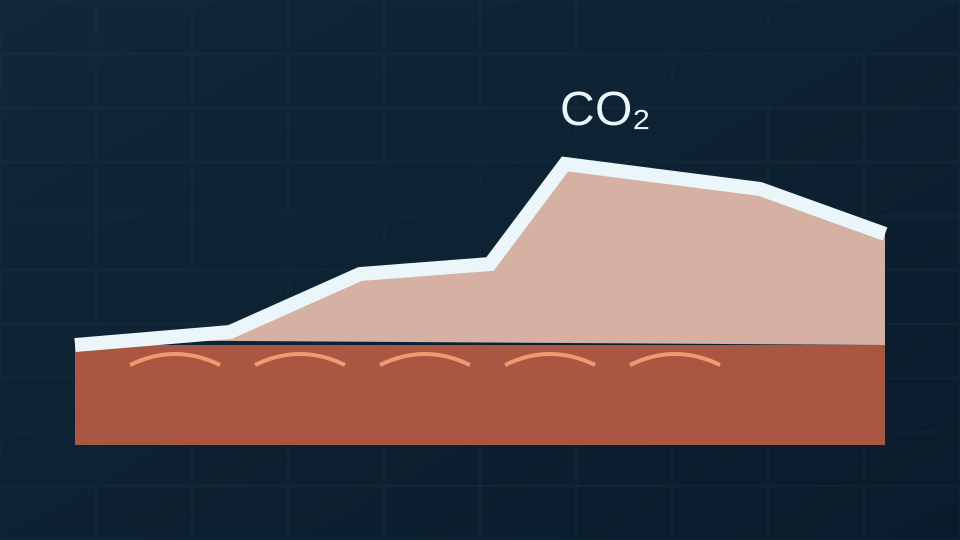
The Martian south pole has layered deposits of ice and dust. In winter, carbon dioxide from the atmosphere becomes frost; as it warms, it sublimates directly back to gas. Wind transports dust and exposes or buries older layers. Cliffs and swirls develop over a long history of deposition and erosion; their age cannot be read from one photograph. Repeated flyovers and terrain maps matter more than appearance alone.
A displays elevation using colours that are not the ground’s natural colours. If a height pattern matches a bright border in a photograph, we may be seeing a sunlit slope. If a dark stripe remains on level ground or changes with the seasons, composition or moving material becomes more plausible. That is how planetary geology works without a hand-held sample: several kinds of remote measurement constrain a story about the processes involved.
Original NZM illustration · Sources: ESA
A further detail
High-resolution images may show layers, but each pale band does not automatically represent one Martian year. Layers can form at different rates, be eroded or later covered again. To interpret climate history, geologists compare their width and continuity, their relationship with nearby landforms and models of changes in Mars’s orbit. Carbon-dioxide frost settles and retreats seasonally, while water ice may persist much longer. Distinguishing them requires spectroscopy, not merely a photograph. Mars Express has orbited the planet for many years, making comparison of new and old images possible. Differences between images need care, however: changes in Sun angle, filters or atmospheric dust can mimic ground change. When photographs, spectra and topography agree, researchers can narrow the possible processes more strongly. That is why the elevation map accompanying this story matters as much as the lead image.
Mars has no familiar oceans or trees to give an immediate sense of scale. An image therefore needs its scale bar and elevation data. A cliff appearing as a thin line on a screen can be taller than many mountains on Earth. Scale changes the geological interpretation.
Key terms
— a height map that reveals landforms even when a photograph obscures them.